Web Analytics: Tracking & Analyzing Website Data
![]()
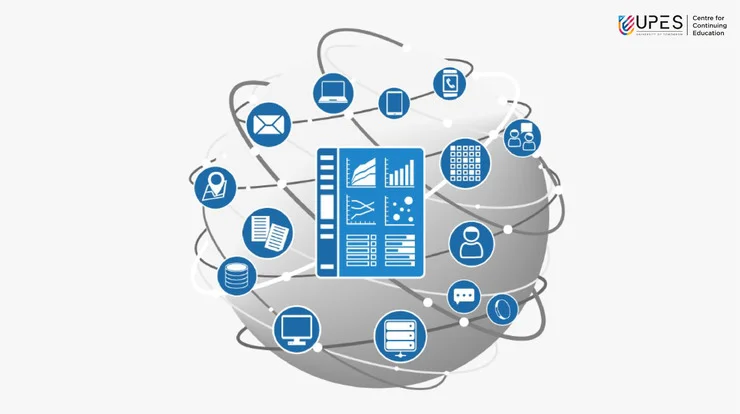
The web analytics process begins with implementing tracking codes and tags on the website. These codes gather user interaction data, including page views, clicks, time spent on the website, and conversion rates. Web analytics tools and technologies are then used to store and process this data.
What is web analytics?
Tracking and analyzing website data is known as web analytics, which is done to enhance user experience and optimize website performance as well as learn more about user behavior.
One common example is using tools like Google Analytics to track website traffic, analyze user engagement, and measure conversion rates to make informed decisions for website optimization.

Top Pillars of Web Analytics
Web analytics encompasses several key pillars in tracking and analyzing website data. These pillars provide a framework for understanding and leveraging web data. The benefits include raising conversion rates, discovering marketing possibilities, enhancing user experience, and accelerating growth. Here are the principal ones:
Data Collection:
This includes implementing tracking codes and tags, such as JavaScript or pixels, to capture user interactions and behaviors. Data collection also extends to integrating other data sources, such as customer relationship management (CRM) systems or advertising platforms, to comprehensively view user activities.
Data Measurement and Metrics:
Once the data is collected, the next pillar focuses on measuring and defining relevant metrics. This pillar involves identifying key performance indicators (KPIs) that align with business objectives. Metrics can include page views, unique visitors, conversion, click-through, bounce rates, and more. By measuring these metrics, businesses can assess the performance of their website and specific marketing campaigns.
Data Analysis:
It involves analyzing collected data to uncover patterns, trends, and insights. The goal is to transform raw data into meaningful information that can drive decision-making and optimization strategies.
Increase in conversion rate by 20% after implementing web analytics tracking.
Reporting and Visualization:
Charts, graphs, and dashboards are just a few examples of data visualization techniques that make it easier to analyze complex data. Reporting and visualization make it simple for stakeholders to understand and share the results, encouraging cooperation and well-informed decision-making.
Continuous Improvement:
Continuous improvement involves using insights gained from data analysis to make informed changes and optimizations to the website and digital marketing strategies. It entails setting benchmarks, establishing goals, implementing A/B testing, and monitoring the impact of adjustments made.
A web analytics API allows developers to programmatically access and retrieve data from analytics platforms, enabling integration with other applications or systems for advanced analysis and customization.
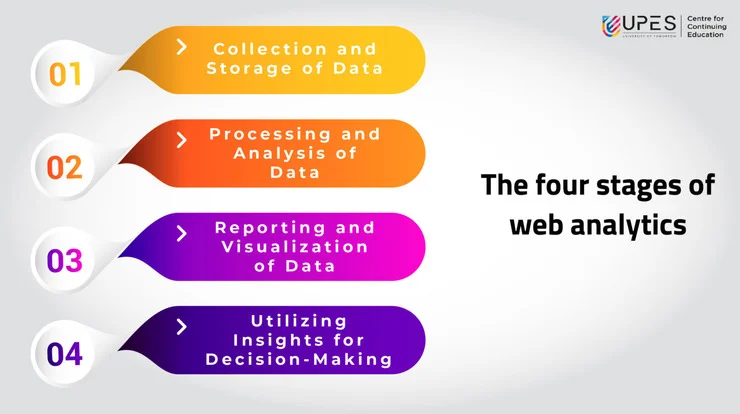
The Four Stages of Web Analytics
Web analytics follows a systematic process that involves four distinct stages. These stages provide a structured approach to effectively utilize web data and derive meaningful insights from it.
What do website analytics allow you to do?
You may evaluate website performance, discover areas for development, and make data-driven decisions to improve your online presence by using website analytics to gather insightful information about user activity.
The four stages of are:
1. Collection and Storage of Data:
The first stage focuses on collecting and storing data from various sources. This involves implementing tracking codes, such as JavaScript or pixels, to capture user interactions and behaviors on the website. Additionally, data from other sources, such as CRM systems or advertising platforms, may be integrated to create a comprehensive dataset.
2. Processing and Analysis of Data:
The second stage of data processing involves transforming raw data into meaningful insights by applying various analytical techniques such as statistical analysis, data mining, machine learning algorithms, and other advanced analytical methods. The goal is to extract valuable information to provide insights into user behavior and website performance.
3. Reporting and Visualization of Data
Data visualization techniques, such as charts, graphs, and dashboards, present and analyze the analyzed data quickly. This helps stakeholders to quickly grasp key insights and make informed decisions based on the findings while also ensuring effective communication of the data to relevant stakeholders.
4. Analytics
It tells you information crucial for improving your website and marketing initiatives, including the number of visitors to your site, their location, the pages they visit, how long they spend on each page, the source of traffic, and conversion metrics.
Utilizing Insights for Decision-Making:
The final stage focuses on utilizing the insights gained from web analytics to drive decision-making and optimize website performance. The insights derived from the data analysis can guide businesses in identifying areas for improvement, developing strategies, and making data-driven decisions. This stage involves setting actionable goals, implementing optimization strategies, conducting A/B testing, and monitoring changes’ impact.
How to Use Web Analytics
Web analytics provides valuable insights into user behavior and website performance, but knowing how to use this data effectively is crucial for deriving actionable insights and driving meaningful improvements. Here are key steps to effectively use web analytics:
- Define Objectives and Key Performance Indicators (KPIs)
- Implement Tracking and Measurement Tools
- Analyze and Interpret Website Data
- Take Action Based on Insights Gained
- Monitor Performance and Refine Strategies
- Stay Informed and Evolve with Analytics Practices
What insights can you draw from Web Analytics
In web analytics, you can draw insights regarding user behavior, website performance, content effectiveness, conversion funnel optimization, audience segmentation, and the impact of marketing campaigns, enabling data-driven decision-making for continuous improvement.
The Difference Between Data Analytics and Web Analytics
While data analytics and web analytics are closely related, they have distinct focuses and applications within the broader analytics field. Understanding the differences between these two disciplines is essential for leveraging them effectively in business contexts. Here are the key distinctions between data analytics and web analytics:
1. Scope and Data Sources:
- Data Analytics: Data analytics encompasses a broader scope and deals with analyzing data from various sources, including but not limited to websites. Data analytics provides insights into overall business performance, customer behavior, market trends, and other relevant aspects beyond web-based interactions.
- Web Analytics: Web analytics, on the other hand, has a narrower scope and focuses specifically on tracking and analyzing website data. It primarily deals with data related to user interactions, behavior, and performance metrics within the online environment. Web analytics tools capture information such as page views, click-through rates, conversion rates, and traffic sources, providing insights into website-specific metrics.
2. Purpose and Application:
- Data Analytics: It helps businesses understand customer preferences, optimize marketing campaigns, improve operational efficiency, and make data-driven decisions across various business functions.
- Web Analytics: Web analytics primarily optimizes user experience and website performance. It provides insights into website usability, user engagement, conversion rates, and marketing campaign effectiveness within the digital ecosystem. Web analytics aims to enhance website performance, increase conversions, and improve overall user satisfaction.
3. Tools and Techniques:
- Data Analytics: Data analytics utilizes many tools and techniques to analyze large datasets. In addition, data analytics often involves advanced analytics techniques to derive insights from complex and diverse data sources.
- Web Analytics: Web analytics commonly relies on specialized web analytics tools and platforms, such as Google Analytics, Adobe Analytics, or similar mechanisms. These platforms provide specific features and metrics tailored to track and analyze website data. Web analytics tools offer traffic analysis, conversion tracking, behavior flow visualization, and A/B testing functionalities.
4. Context and Business Impact:
- Data Analytics: Data analytics has a broader business impact, providing insights across various business areas. It helps optimize marketing strategies, improve operational efficiency, identify new revenue opportunities, enhance customer experience, and support data-driven decision-making at the organizational level.
- Web Analytics: Web analytics primarily impacts online initiatives and digital marketing strategies. It helps businesses optimize website design, content, and user experience to increase conversions, improve SEO performance, and enhance online marketing campaigns. In addition, web analytics provides specific insights into website performance, enabling businesses to make targeted improvements online.
Conclusion
Understanding user behavior, enhancing the user experience, and maximizing website performance all depend on website analytics. The importance of website analytics cannot be overstated, as it provides valuable insights that drive data-driven decision-making and help businesses achieve their goals in the digital landscape.
UPES Online Admission Enquiry
Recommended Courses


Latest Blogs

UPES Online MBA vs Other Top Universities: Why Students Prefer UPES
Compare UPES Online MBA with other top universities. Know why students prefer UPES online over others. Check fee, flexibility, faculty, ROI, & career scope.
Read MoreOct 1, 2025 I 7 mins
What Are the Best Online MBA Programs at UPES Online?
Choose the best online MBA programs at UPES Online. Learn about specializations, career scope, & why professionals choose UPES for flexible learning.
Read MoreOct 15, 2025 I 6 mins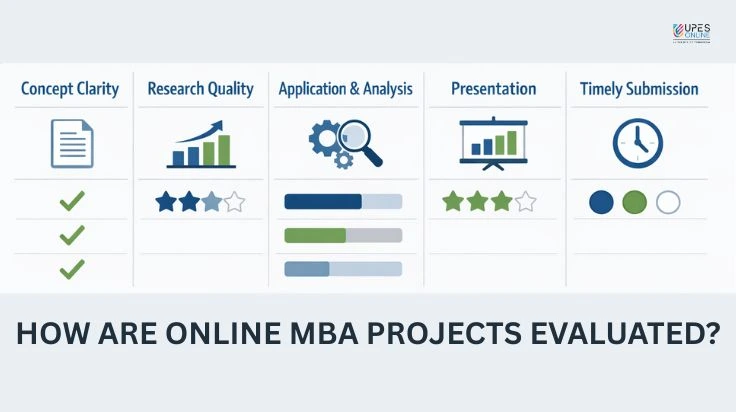
How Are Online MBA Projects & Assignments Evaluated?
Learn how online MBA projects & assignments are evaluated, including capstone criteria, grading rubrics, tools used, & academic support systems.
Read MoreJan 20, 2026 I 6 mins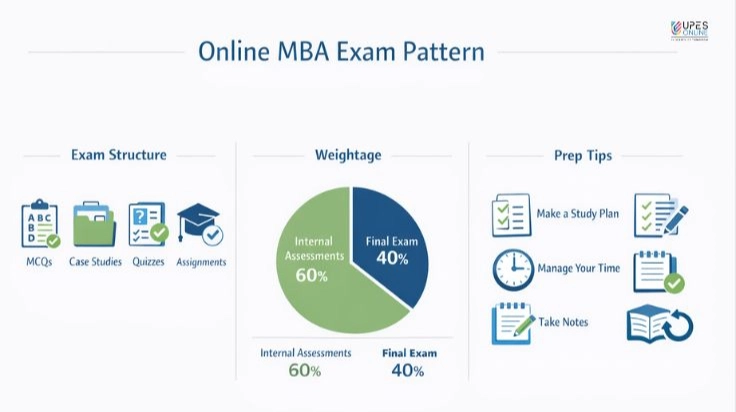
Online MBA Exam Patterns: What to Expect & How to Prepare
Know the online MBA exam pattern in India. Assessment weightage, proctored exams, security & practical preparation strategies for online learners.
Read MoreJan 20, 2026 I 7 mins
Online MBA Colleges in India: Offerings, Accreditations & Value
Compare top online MBA colleges in India by fees, rankings, UGC approval, specialisations, career value. A practical guide for students & working professionals.
Read MoreFeb 15, 2026 I 6 mins
MBA Digital Marketing vs Marketing: Key Differences, Salary & Which is Better?
Confused between MBA in Digital Marketing vs Marketing? Compare salary, scope, skills & career growth in India (2026 guide).
Read MoreMay 9, 2026 I 6 mins
Related Articles
Prescriptive Analytics: Using Data to Make Better Decisions
Learn types of prescriptive techniques & examples of prescriptive analytics to make data analytics & business analysis a detailed & accurate process.
Read Blog
Predictive Analytics: Predicting Future Trends and Outcomes
Learn the importance of predictive analysis in a dynamic business environment with examples and tools for predictive analysis.
Read Blog
Text Analytics: Analyzing Text Data to Extract Meaning and Insights
Learn about successful techniques & tools for text mining, text analytics & types of text analytics to derive most insightful data interpretations.
Read Blog
Data Mining: Uncovering Hidden Patterns and Relationships in Data
Data mining in India has many hidden patterns which have application of these patterns of data mining in business processes.
Read BlogPrescriptive Analytics: Using Data to Make Better Decisions
Learn types of prescriptive techniques & examples of prescriptive analytics to make data analytics & business analysis a detailed & accurate process.
Read BlogPredictive Analytics: Predicting Future Trends and Outcomes
Learn the importance of predictive analysis in a dynamic business environment with examples and tools for predictive analysis.
Read BlogText Analytics: Analyzing Text Data to Extract Meaning and Insights
Learn about successful techniques & tools for text mining, text analytics & types of text analytics to derive most insightful data interpretations.
Read BlogData Mining: Uncovering Hidden Patterns and Relationships in Data
Data mining in India has many hidden patterns which have application of these patterns of data mining in business processes.
Read Blog